Improving performance with Profiler and Claude Code
Cartographer has a large drag-and-drop canvas to organise the story map. I hate janky software and I don’t intend to ship any, so making this drag/drop performance work well is of high importance.
I’m using dnd-kit to handle the drag/drop, and it works great. I cut a bunch of corners as I developed my functional requirements, knowing I’d have to come and refactor to get the performance I expect. When it comes to optimising these things, I’m no expert - I know how I want it to feel, I can tell when it feels wrong. Here’s how I tackled it.
React Profiler
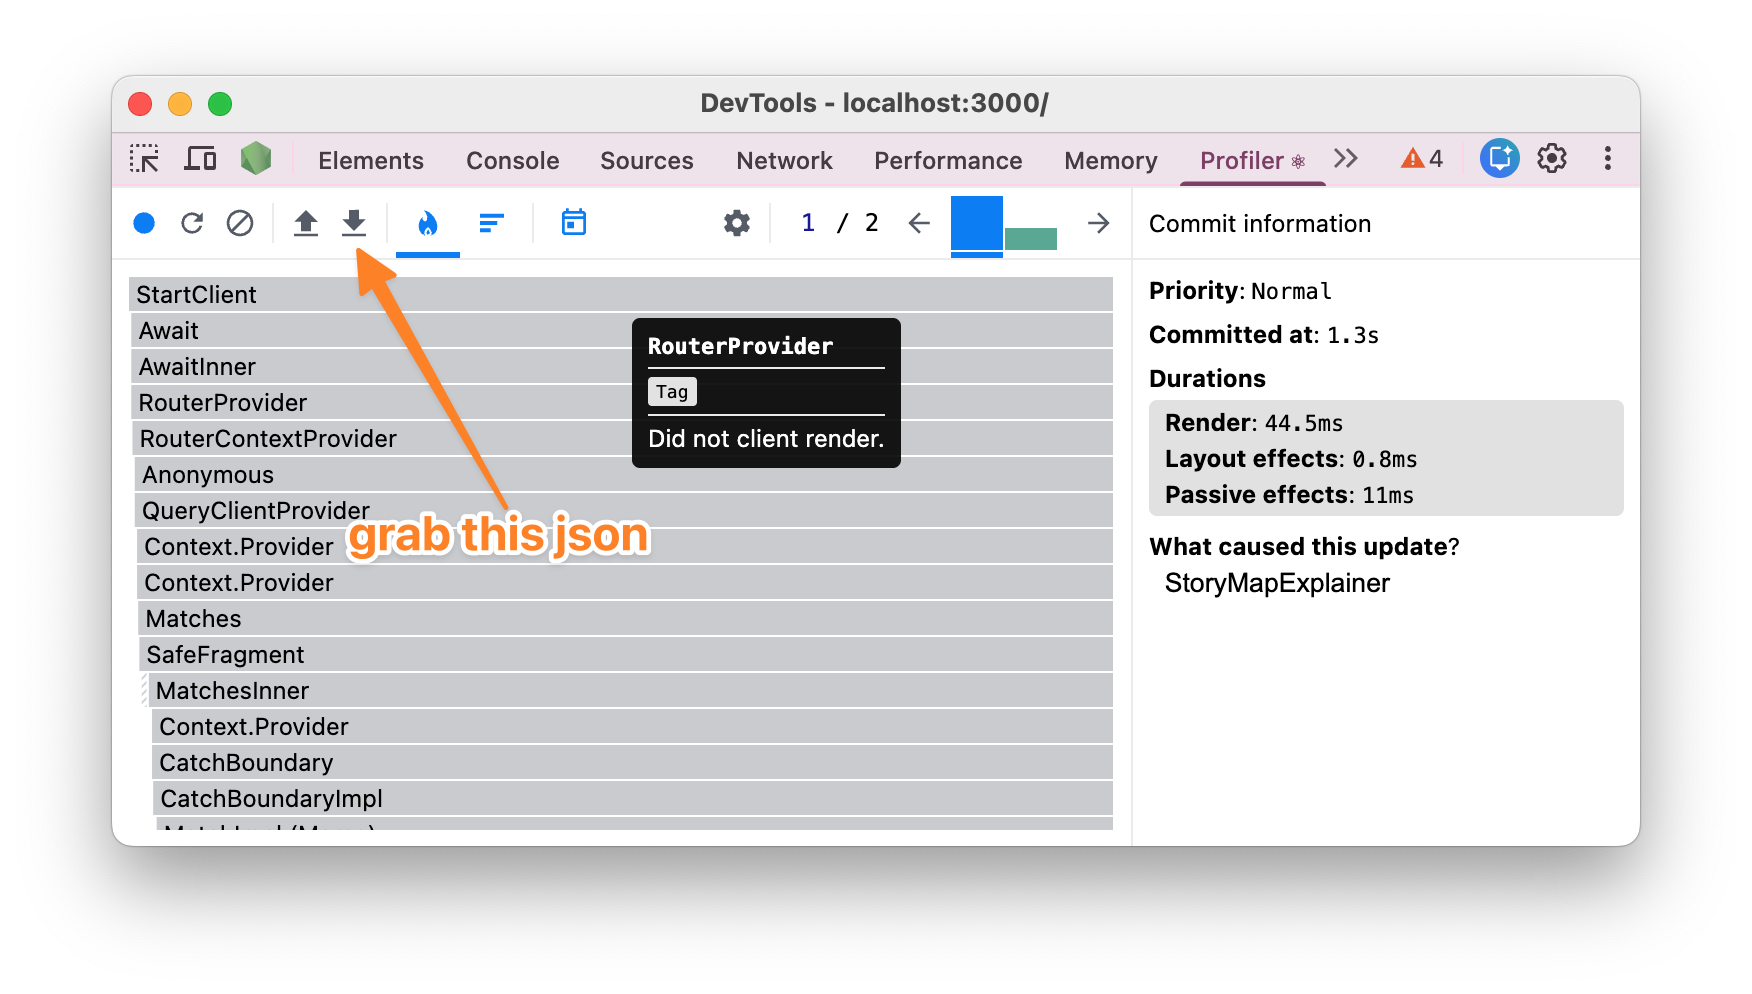
React DevTools ships with a Profiler, which essentially lets you record problematic interactions, and then generates a visualisation of what’s taking so dang long to render so we can do something about it.

Chrome DevTools extension for React: inspect component trees in Components and record renders in Profiler. Open source; does not transmit data remotely.
The Profiler helps us track and visualise:
- fibers: React’s representation of each component/node it’s tracking
- commits: Changes React applies to the DOM.
- When something triggers a render, how long does it take to figure out what changed (find the affected fibers) and apply the necessary changes (commit)
For example - it’s possible to right-click on a draggable-card and take actions. Profiler helped me discover that I was rendering that dropdown menu when dragging - and then rendering it when all the cards shifted to make space for the drop-zone underneath too. A quick refactor saves us hundreds of milliseconds.
I had structured my store in a way that caused cards to re-render more than they needed to. A quick refactor saves us hundreds of milliseconds.
Buuuuuut… we’re still not quite where I’d like us to be.
React Profiler JSON + Claude Code
You can export your profiler data to JSON - which is a great way to have our clanker friends help us identify more nuanced optimisations.
I made a habit of dropping the JSON into my src directory so Claude can easily access it. Make a change, profile again, iterate.
Eventually, I had a bunch of these profiles, timestamped1 and easy for Claude to both work with.
Prevent regressions with a Skill
This isn’t my first time performing this activity - Cartographer gets more complex, my state gets more complex, and ultimately, those shaved-off milliseconds have a tendency to creep back. We don’t want that.
The optimisations made are unique to Cartographer. I asked Claude to summarise all the changes made during our session, review the full history of the profiles, and make some rules that are unique to my project and create a Skill.
I’ve published a Skill on how to work with React Profiler JSON files to improve performance here:
npx skills add https://github.com/lloydhumphreys/skills --skill react-performance-profilerClaude vs Codex?
I tried using Codex for this task too, and I found that it struggled. Claude would write/modify temporary python scripts to process the Profiler JSON, whereas it appears Codex would just search through it. I think this meant Claude had a more specific understanding of the issues, and thus more targeted changes & greater success.
Final stats
Claude and React Profiler working together helped us achieve:
- 84% reduction in component tree size
- 82% drag-start render time improvement (66ms)
- 95% fewer fibers rendered on drag-start
- 76% faster max commit duration
- 80% faster p95 commit duration
Footnotes
-
I spent way longer than I’d have liked on this process! ↩